The average value of the Press Freedom Index across all 180 countries and territories is as low as it has ever been since the start of the index in 2002. For the first time in the history of the index, more than half of the world’s countries and territories fall into the “difficult” or “serious” categories – compared to 13.7% in 2002. The proportion of the world population living in a country classified as “good” has plummeted from 20% in 2002 to less than 1% today.
Press Freedom Index 2026: Lowest value in 25 years
In April 2026, RSF published its 25th World Press Freedom Index. Although the methodology for calculating the index has changed several times, the average value across all 180 countries and territories is as low as it has ever been since the index began in 2002. For the first time in the history of the index, more than half of the world’s countries and territories fall into the “difficult” or “serious” categories – compared to 13.7% in 2002. The proportion of the world population living in a country classified as “good” has plummeted from 20% in 2002 to less than 1% today.
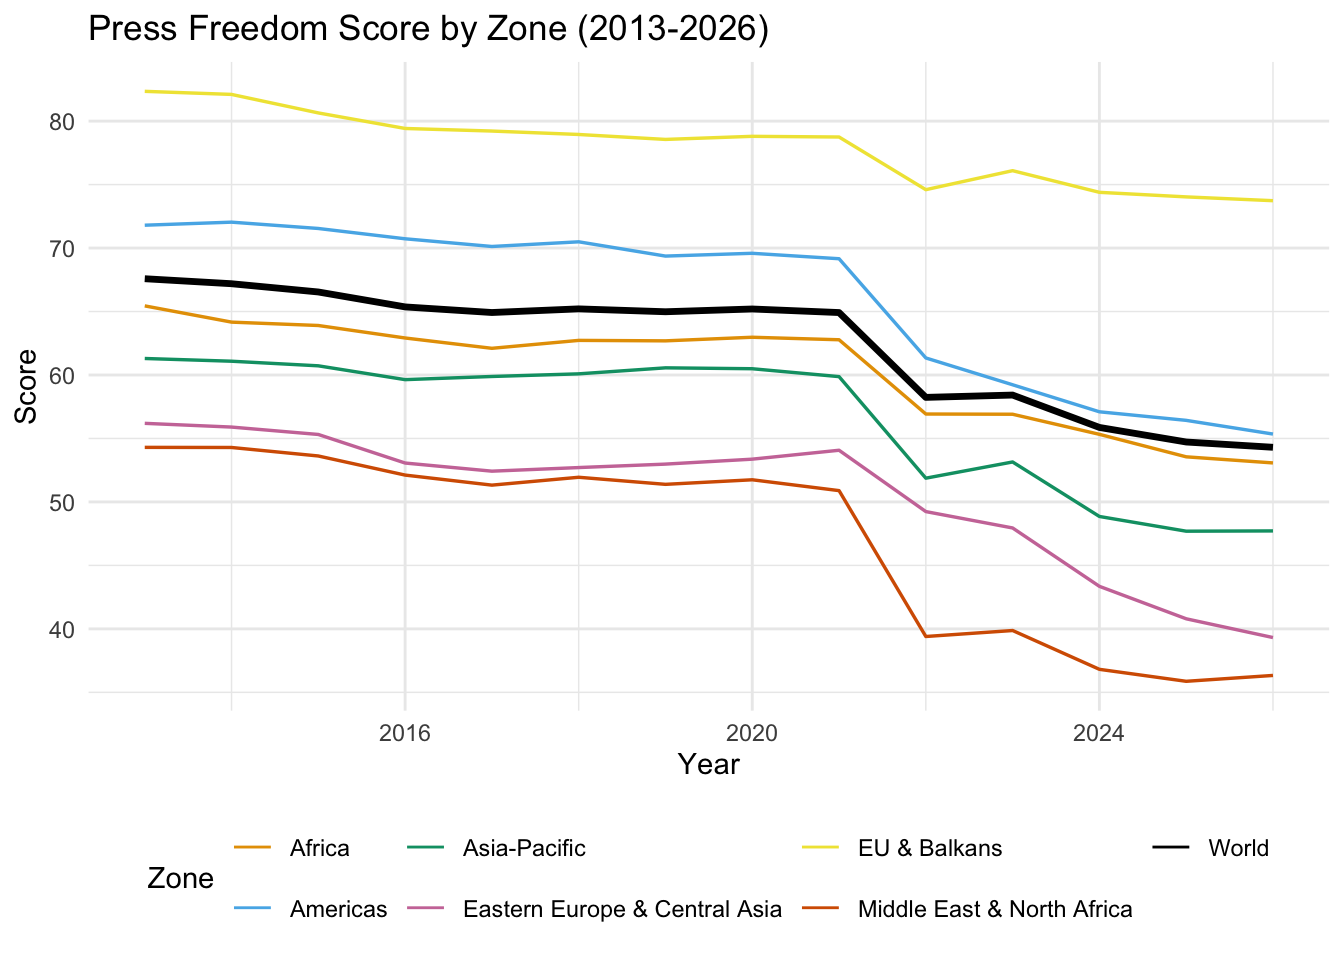
Thirteen years of slow decline, then two cliffs
library(tidyverse)library(pressfreedom.data)data(rwb_standardized)df<-rwb_standardized|>filter(year_n>=2013, year_n<=2026)|>select(year_n, zone, score)|>drop_na()zone_avg<-df|>group_by(year_n, zone)|>summarise(score =mean(score), .groups ="drop")world_avg<-df|>group_by(year_n)|>summarise(score =mean(score), .groups ="drop")|>mutate(zone ="World")plot_data<-bind_rows(zone_avg, world_avg)ggplot(plot_data, aes(x =year_n, y =score, color =zone, linewidth =zone))+geom_line()+scale_linewidth_manual( values =c("World"=1.2, setNames(rep(0.6, n_distinct(df$zone)), unique(df$zone))), guide ="none")+scale_color_manual( values =c("World"="#000000","Africa"="#E69F00","Americas"="#56B4E9","Asia-Pacific"="#009E73","EU & Balkans"="#F0E442","Middle East & North Africa"="#D55E00","Eastern Europe & Central Asia"="#CC79A7"))+labs( title ="Press Freedom Score by Zone (2013-2026)", x ="Year", y ="Score", color ="Zone")+theme_minimal()+theme(legend.position ="bottom", legend.box ="vertical")
Figure 1: Press freedom scores by zone, 2013–2026. The black line is the world average. Two step-downs — 2021→2022 and 2023→2024 — interrupt an otherwise gradual, decade-long slide.
Every zone declines across this window, and no zone is spared even in the years where the world average holds roughly flat. But the shape isn’t a smooth slide — from 2013 to 2021 the world average drifts down by a point or so most years, and then two sharper step-downs interrupt that pattern: 2021→2022 and 2023→2024. Both are large enough, relative to the surrounding years, to treat as distinct events rather than continuations of the underlying trend.
Press Freedom: Where does the world stand today?
As early as 2008, I wrote in this German blog, Gedankensplitter, about the poor state of press freedom and published the RSF call for a cyber-demonstrationhttps://peter.baumgartner.name/2008/03/13/cyberdemonstration/. Since then, the situation has worsened significantly:
RSF divides each country’s score into five categories:
Good (85–100),
Satisfactory (70–85),
Problematic (55–70),
Difficult (40–55),
Critical (0–40).
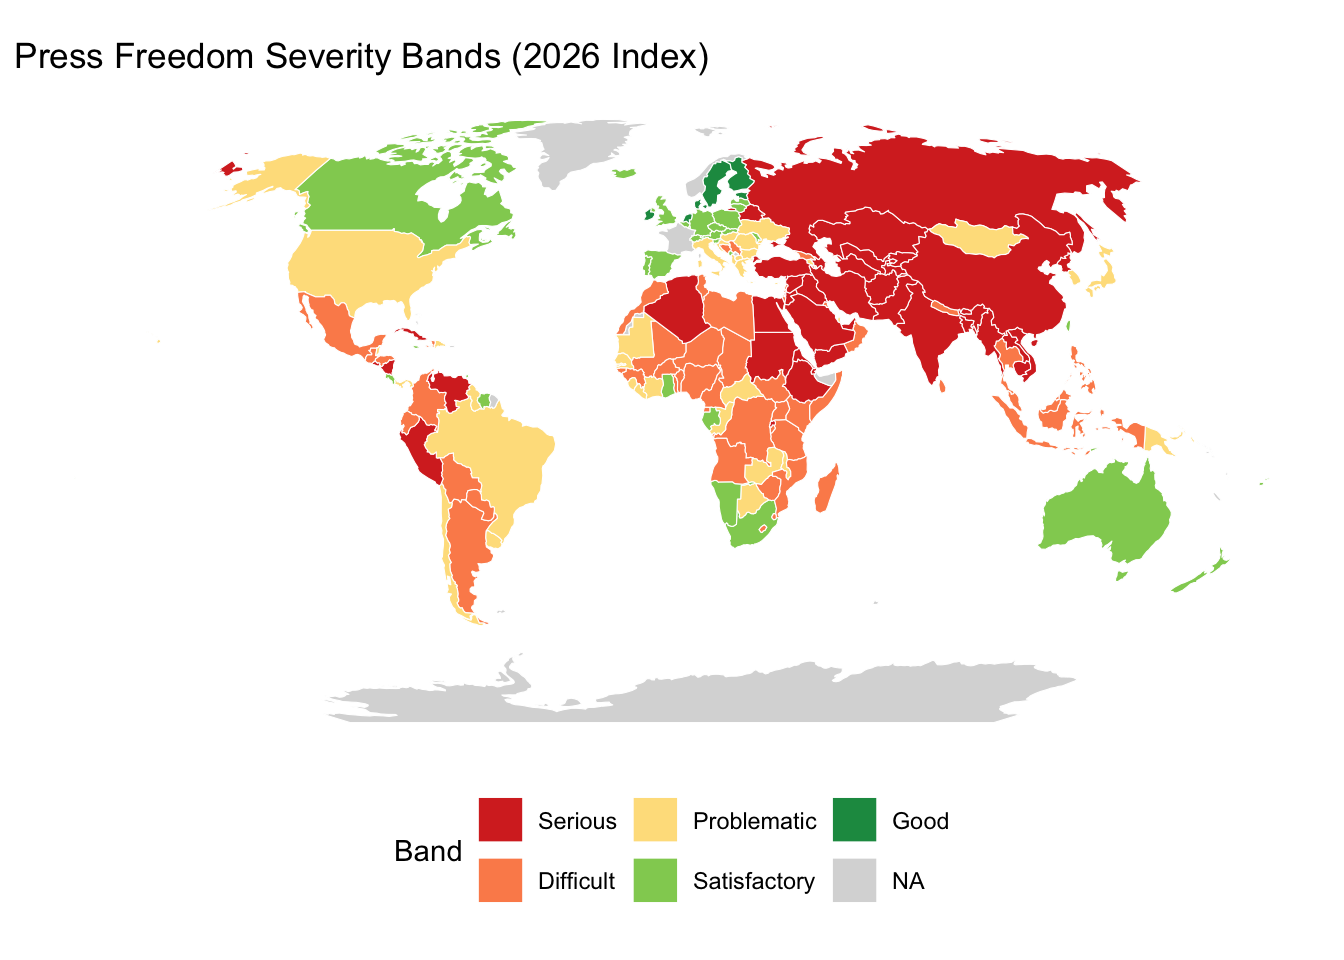
Mapping the 2026 scores against those bands shows how much of the world now sits in the bottom two.
Figure 2: Press freedom severity bands by country, 2026 Index. Bands follow RSF’s own categories: Good (85-100), Satisfactory (70-85), Problematic (55-70), Difficult (40-55), Serious (0-40).
The map of the 2026 scores1, color-coded with these categories, shows how much of the world now lies in the bottom two ranges: The map makes the statistic “more than half the world” tangible: The red and orange categories extend across large parts of Eastern Europe, Central Asia, the Middle East, as well as large parts of Africa and Asia, while the green areas are concentrated in Northern and Western Europe as well as some outposts (Canada, parts of Oceania, and a few countries in Latin America and Africa).
RSF Analysis of the Press Freedom Index
RSF’s own analysis for 2026 states that the mechanisms of decline have diversified. The classic instruments – imprisonment, violence, direct censorship – have not disappeared, but are now being supplemented by subtler, legal, and economic means of pressure that are even penetrating established democracies.
Criminalization through laws
RSF names legal indicators as the sharpest single driver of the decline in the Press Freedom Index this year, which has worsened in more than 60% of the 180 countries monitored. Much of this occurs through national security, defamation, and emergency laws – laws originally passed for other purposes, now used as a side effect to persecute journalism. RSF describes this as a 25-year legacy of expanded national security law after 9/11, which has now reached a turning point. Strategic Lawsuits Against Public Participation (SLAPPs) – costly legal proceedings aimed at intimidating rather than winning – are part of the same pattern, and RSF notes that they have expanded from a handful of countries to many other very different countries, such as Bulgaria, Guatemala, and France.
Political hostility by elected leaders
Several of the steepest national declines in the 2026 Press Freedom Index stem from heads of government treating the press as an adversary rather than a watchdog. The United States has fallen seven places, which RSF attributes to a “systematic policy” of attacks on journalists and press institutions by the US President. Argentina under Javier Milei and El Salvador under Nayib Bukele both saw significant declines specifically due to a deterioration in political and social indicators – not due to conflict or economic collapse, but to governments that treat criticism as something that must be punished.
Economic pressure and platform dependency
RSF’s broader analysis over the last 25 years names predatory economic actors and unregulated online platforms alongside authoritarian states as directly responsible for the decline – media houses under pressure due to shrinking advertising revenues and increasingly dependent on platforms whose incentives do not align with independent journalism.
Armed conflicts
Where wars rage, press freedom collapses most quickly and visibly. Since October 2023, more than 220 journalists have been killed in the Gaza Strip by the Israeli military, at least 70 of them while working. The ongoing civil war in Sudan has, according to RSF, almost wiped out independent journalism there. And the steepest single-country drop in the entire 2026 Press Freedom Index – Niger, with a drop of 37 places – reflects a broader collapse in the Sahel zone, where military juntas and armed groups use security laws to exclude independent reporting.
Summary: Not new causes, but simultaneous effectiveness
None of these four mechanisms is new in itself. What characterizes the year 2026, according to RSF, is that they are acting simultaneously – both in democracies and in autocracies – which is also the reason why the overall value itself is steadily declining even in years without a single dominant crisis.
For those who want to explore the Press Freedom Index data themselves, the accompanying Shiny app lets you dive into individual countries and zones. If you are familiar with R, you can also download the pressfreedom.data package and perform your own analyses with the standardized dataset.