In the last post, I provided a current overview of the global state of press freedom. It showed a continuous decline since 2002—the first year the Press Freedom Index was created—characterized by two significant ‘crashes’: 2021 and (less pronounced) 2024. In this article, I attempt to go into more detail regarding the reasons for these declines.
journalism
pressfreedom
pressfreedom.data
R
Author
Peter Baumgartner
Published
September 8, 2026
Modified
September 8, 2026
Peter Baumgartner
Crisis 2022
Unlike the second (smaller) crisis in 2024, detailed data on individual index components are not available for 2022. However, it can be assumed that the COVID-19 crisis, which was most tangibly experienced in 2021/2022 due to lockdowns, was a major factor responsible for the steep decline.
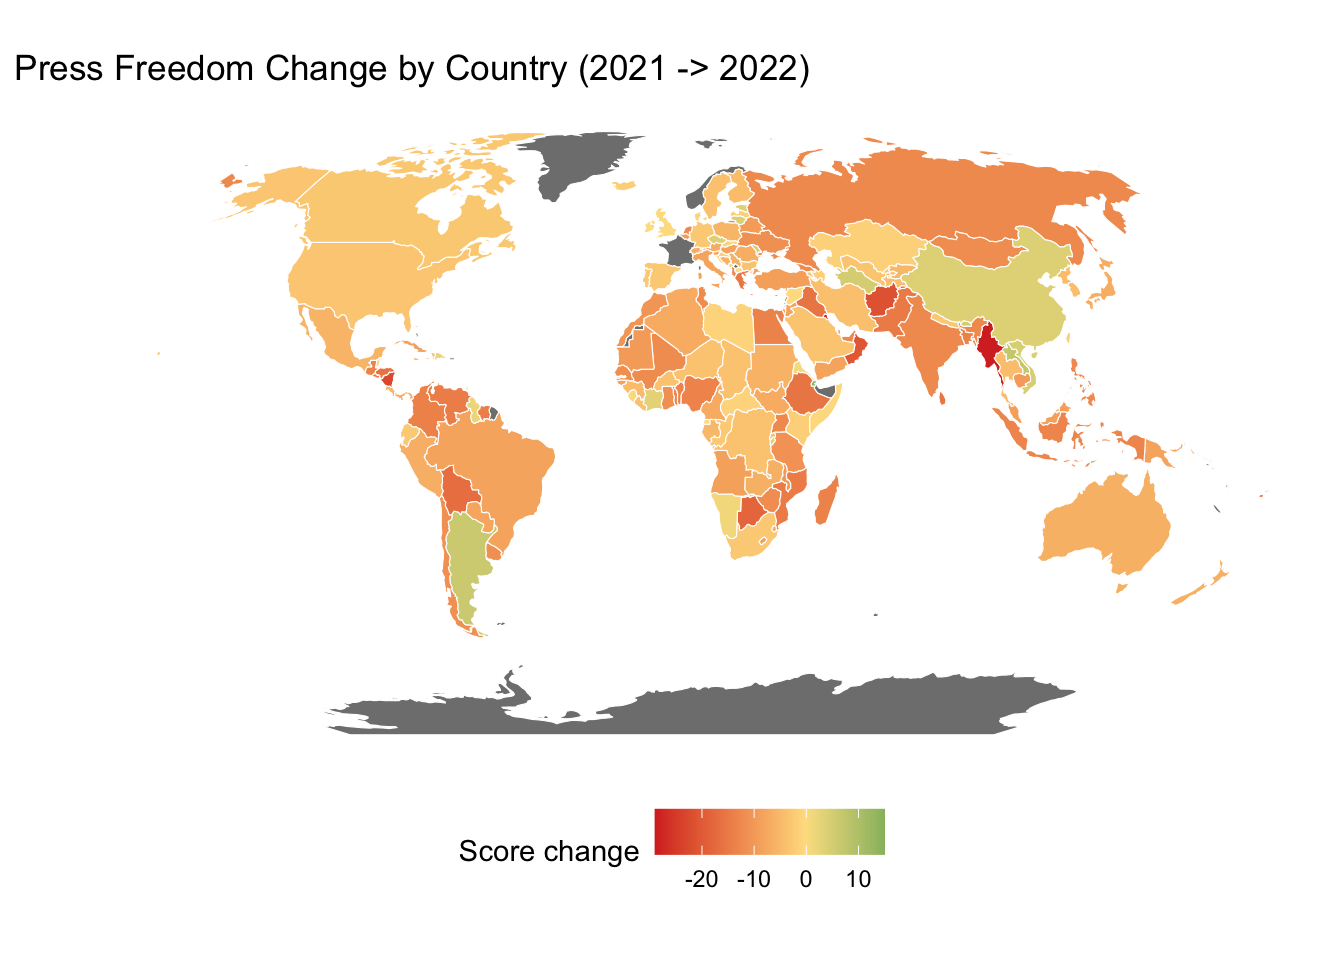
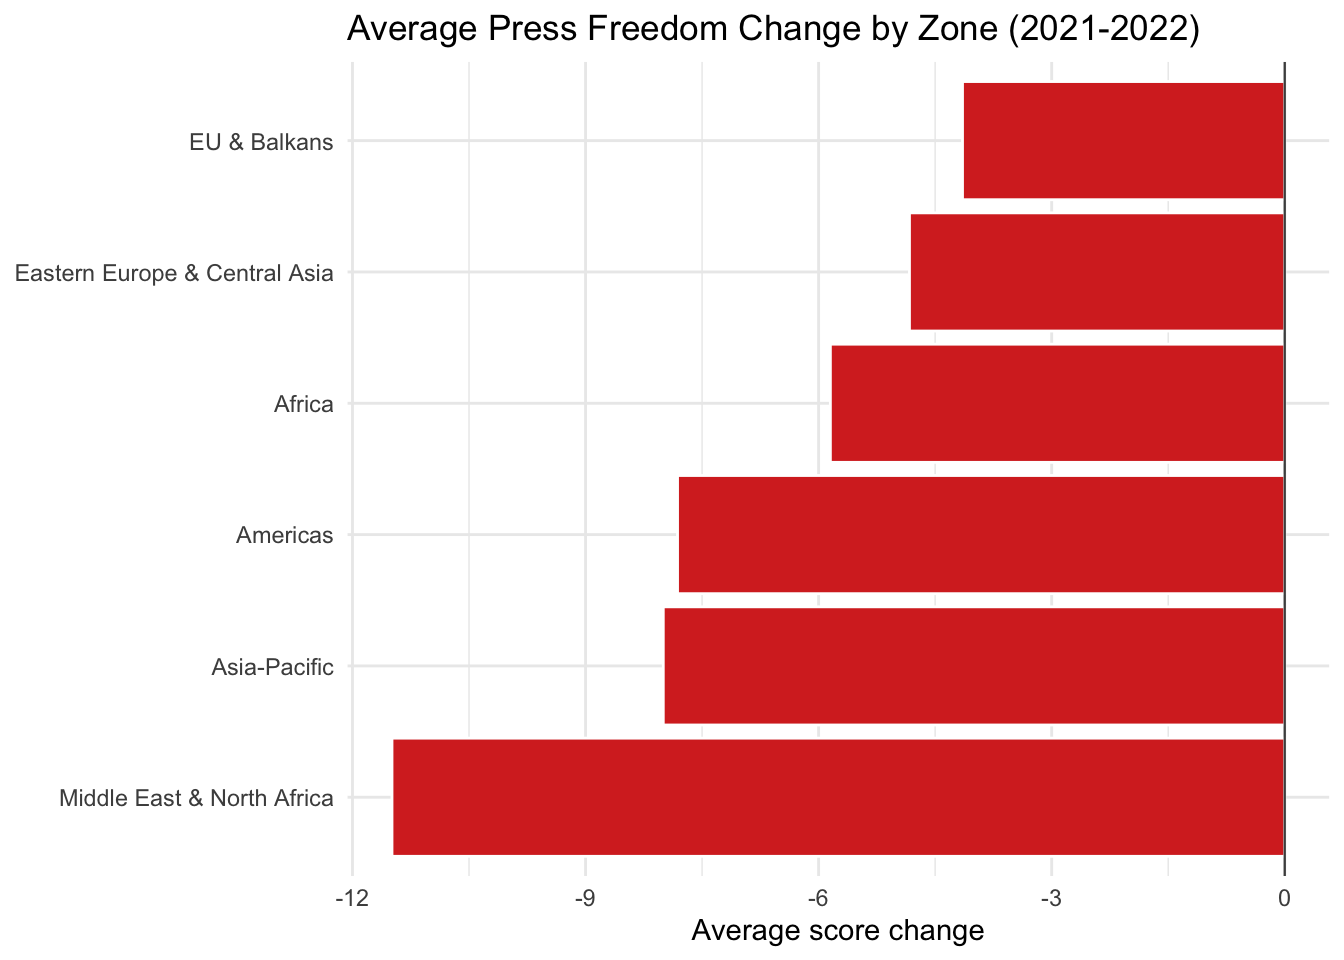
Of the 180 countries with complete data for 2021 and 2022, 151 (about 84%) recorded a decline, while only 29 saw an improvement. The Middle East and North Africa showed the steepest average decline (−11.5 points over 19 countries); the EU and Balkans were relatively the most resilient—though this zone also recorded an average decline. The following world map provides a detailed representation of the development in individual countries.
Every year, RSF publishes its press freedom rankings as a fresh CSV, and every year the column names, category labels, and even some country-name spellings shift slightly. Reconciling 24 years of that into one analyzable table was a project of its own — I’ve written about the encoding problems (Encoding Resilience), the judgment calls involved in cleaning it (When Data Cleaning Becomes Decision-Making), and the pipeline I eventually built to keep it updated without redoing the work by hand every year (Automation versus Judgment Calls).
The result is pressfreedom.data, an R package with one standardized table, rwb_standardized, covering 2002–2026 across roughly 180 countries a year. Every figure in this post is generated directly from that table — no manually copied numbers, no separate spreadsheet.
I’ve also put together a companion Shiny app for exploring the same data interactively: trends by zone, drill-downs into individual countries, and a data export if you want to run your own analysis. If a claim in this post looks surprising, check it against the raw numbers.
Where 2022 and 2024 sit in the longer 2002–2026 trend — a sudden step down against an otherwise gradual slide — is covered with a chart in the previous post; I won’t repeat it here. What matters for this post are the reasons why these steps occurred.
RSF’s account 2021/2022: An “Era of Polarization”
Without sub-indicators, the best source I have for why is RSF’s own thematic reporting from that year. RSF framed 2022 as a turning point, characterized by a shift from the slower institutional and economic pressures of prior years toward something closer to active information conflict. Four themes run through their reporting:
Information chaos. Unregulated online spaces let disinformation spread largely unchecked, and RSF pointed specifically to the United States and France as places where internal political polarization fed into, and was fed by, a fractured media landscape. The effect wasn’t censorship in the classical sense — it was an erosion of shared, trusted sources of information.
Authoritarian weaponization of information. Russia’s invasion of Ukraine was preceded by, and accompanied by, an intensified domestic propaganda effort. RSF described a broader pattern of authoritarian states treating controlled information as a strategic tool rather than a purely domestic control mechanism. China’s tightening was framed in similar terms.
Consolidation inside “illiberal democracies.” RSF pointed to Poland as a model case: public broadcasting brought under direct government influence, pressure applied to private outlets. A record number of countries — 28, by RSF’s count — fell into the “very bad” category that year, a threshold meant to flag not just autocracies but democracies using legal and administrative tools against the press.
Social media as amplifier. RSF’s framing put some of the blame on platform incentives that reward divisive content, plus the rise of openly partisan “opinion media” that blurs the line between journalism and advocacy. Both trends, in their account, increase pressure and harassment aimed at individual journalists.
Taken together, RSF’s own explanation for 2022 isn’t a single cause — it’s several distinct mechanisms operating at once: geopolitical conflict, domestic authoritarian consolidation, and polarization within democracies that never had an authoritarian government to begin with. That distinction matters, because those three mechanisms don’t hit the same places.
Where the decline actually landed
You can check RSF’s narrative against where the scores actually moved. Of the 180 countries with complete 2021 and 2022 data, 151 (about 84%) declined and 29 improved.
Figure 1: Press freedom score change by country, 2021→2022. Red indicates decline, green indicates improvement. Eastern Europe and Central Asia, and the Middle East and North Africa, show the most concentrated red.
zone_changes<-change_2021_2022|>group_by(zone)|>summarise(n =n(), mean_change =mean(score_change), .groups ="drop")|>arrange(mean_change)ggplot(zone_changes, aes(x =mean_change, y =reorder(zone, mean_change), fill =mean_change<0))+geom_col(color ="white", linewidth =0.5)+geom_vline(xintercept =0, color ="gray30", linewidth =0.4)+scale_fill_manual(values =c("TRUE"="#d73027", "FALSE"="#1a9850"), guide ="none")+labs( title ="Average Press Freedom Change by Zone (2021-2022)", x ="Average score change", y =NULL)+theme_minimal()
Figure 2: Average press freedom score change by zone, 2021→2022. Middle East and North Africa shows the steepest average decline; EU and Balkans is the most resilient — but every zone declines on average.
The map and the bar chart tell a consistent story, and it maps reasonably well onto RSF’s four themes — though not in a one-to-one way:
Middle East & North Africa had the steepest average decline (−11.5 points across 19 countries) — but this region was already the world’s lowest-scoring, so the decline compounds an existing crisis rather than representing a new one. Palestine (−27.8) and Kuwait (−27.8) are the most severe individual cases.
Asia-Pacific shows the widest spread: Myanmar (−28.8, the largest decline anywhere, following the 2021 military coup), Hong Kong (−27.9, national security law enforcement), and Afghanistan (−21.5, the Taliban takeover) sit alongside countries with no meaningful change at all.
Eastern Europe & Central Asia declined by a more moderate −4.8 points on average, but that average hides the fact that the states most closely tied to Russia’s political orbit tightened control substantially in the months following the invasion of Ukraine.
EU & Balkans was the most resilient zone (−4.1 average) — but “resilient” doesn’t mean unaffected. A handful of member states continued a slower erosion already underway before 2022.
Africa was the most internally variable zone: Botswana declined sharply (−18.3) while Djibouti (+14.4) and Seychelles (+9.0) posted the two largest improvements anywhere in the dataset.
Of the 29 countries that improved, most were smaller states going through post-election stabilization or institutional consolidation — Argentina (+6.3) is the largest exception among bigger democracies.
Three different Reasons hiding in one number
What strikes me most about lining up the map against RSF’s narrative is that “press freedom declined in 2022” is doing a lot of work to describe at least three distinct situations:
Geopolitical conflict (Eastern Europe & Central Asia, and parts of Asia): the Ukraine invasion and its ripple effects — tightening control in Russia’s sphere, direct threats to journalist safety in and around conflict zones.
Democratic backsliding through legal and administrative tools (Central Europe, parts of the Americas): governments using existing democratic institutions — broadcasting regulation, defamation law, advertising allocation — to squeeze independent media without overt censorship.
Internal polarization without direct state action (the United States, France, and similarly fractured media environments): a more diffuse process where trust in journalism erodes from fragmentation and hostility between audiences, not from a government decision.
These aren’t the same problem, and they don’t respond to the same interventions. A press freedom index that reports “−6.7 points” globally is accurate. Still, it flattens three different mechanisms into one number — which is exactly why RSF’s own qualitative reporting matters as much as the score itself.
Crisis 2024
For the analysis of the (smaller) 2023/2024 crisis, better data is available: While RSF data for 2022 did not include a breakdown by sub-indicators, meaning I could describe how hard the crisis hit, I could not judge which dimensions were decisive. For 2024, five sub-indicators are now available (political, economic, legal, social, and security).
Five Contextual Indicators: The score of each country or territory is assessed based on five contextual indicators, which reflect the complexity of the press freedom situation: political context, legal framework, economic context, socio-cultural context, and security.
For each indicator, we calculate a sub-score from 0 to 100. All sub-scores contribute equally to the total score. The sub-scores are calculated from a list of questions sent to press freedom experts in the respective country. Within each indicator, all questions and sub-questions are weighted equally. This detailed questionnaire was first used in 2022.
Political Context: 35 questions and sub-questions serve to assess:
The degree of support and respect for media autonomy against political pressure from the state or other political actors;
The degree of acceptance of various journalistic approaches that meet professional standards, including politically oriented and independent approaches;
The degree of support for the media in its role of holding politicians and governments accountable in the public interest.
Legal Context: 26 questions and sub-questions serve to assess:
The degree to which journalists and media can work free from censorship or judicial sanctions or excessive restrictions on their freedom of expression;
The ability of journalists to access information without discrimination, as well as the ability to protect sources;
The presence or absence of impunity for those responsible for acts of violence against journalists.
Economic Context: 26 questions and sub-questions serve to assess:
Economic restrictions related to government policy (including the difficulty of starting a news outlet, favoritism in the allocation of government subsidies, and corruption);
Economic restrictions related to non-state actors (advertisers and business partners);
Economic restrictions related to media owners attempting to promote or defend their business interests.
Socio-cultural Context: 22 questions and sub-questions serve to assess:
Social restrictions resulting from disparagement and attacks on the press due to themes such as gender, class, ethnicity, and religion;
Cultural restrictions, including pressure on journalists not to challenge certain power centers or not to deal with certain topics because they would contradict the prevailing culture in the country or territory.
Security: 15 questions and sub-questions (2/3 of the security score)
These questions relate to journalists’ safety. For this purpose, press freedom is defined as the ability to identify, collect, and disseminate news and information using journalistic methods and ethics without unnecessary risk of:
Psychological or emotional stress caused by intimidation, coercion, harassment, surveillance, doxing (the malicious publication of private information), defamatory or hateful speech, libel, and other threats against journalists or their relatives;
Professional damage (e.g., loss of employment, seizure of professional equipment, or looting of facilities).
Presentation of the Situation With this additional data, the questions I can ask change. Instead of deriving mechanisms from qualitative reports, I can derive the change directly from the five measured dimensions.
Change of Press Freedom Sub-Indicators 2021/2022
library(tidyverse)library(pressfreedom.data)data(rwb_standardized)decomp_data<-rwb_standardized|>filter(year_n%in%c(2023, 2024))|>select(year_n, zone, political_context, economic_context,legal_context, social_context, safety)|>drop_na()|>group_by(year_n, zone)|>summarise(across(everything(), mean), .groups ="drop")world_decomp<-decomp_data|>group_by(year_n)|>summarise(across(-zone, mean), .groups ="drop")|>mutate(zone ="World")decomp_data<-bind_rows(decomp_data, world_decomp)change_data<-decomp_data|>pivot_longer(-c(year_n, zone), names_to ="indicator", values_to ="value")|>pivot_wider(names_from =year_n, values_from =value, names_prefix ="year_")|>mutate(change =year_2024-year_2023)|>mutate( indicator =factor(indicator, levels =c("political_context", "economic_context", "legal_context","social_context", "safety"), labels =c("Political", "Economic", "Legal", "Social", "Safety")), zone =factor(zone, levels =c("World", sort(unique(zone[zone!="World"])))))ggplot(change_data, aes(x =indicator, y =change, fill =zone))+geom_col(position ="dodge", color ="white", linewidth =0.3)+geom_hline(yintercept =0, color ="gray30", linewidth =0.4)+scale_fill_manual( values =c("World"="#000000", "Africa"="#E69F00", "Americas"="#56B4E9","Asia-Pacific"="#009E73", "EU & Balkans"="#F0E442","Middle East & North Africa"="#D55E00","Eastern Europe & Central Asia"="#CC79A7"))+labs( title ="Change in Press Freedom Sub-Indicators (2023 -> 2024)", x ="Sub-Indicator", y ="Change in score", fill ="Zone")+theme_minimal()+theme(legend.position ="bottom", legend.box ="vertical")
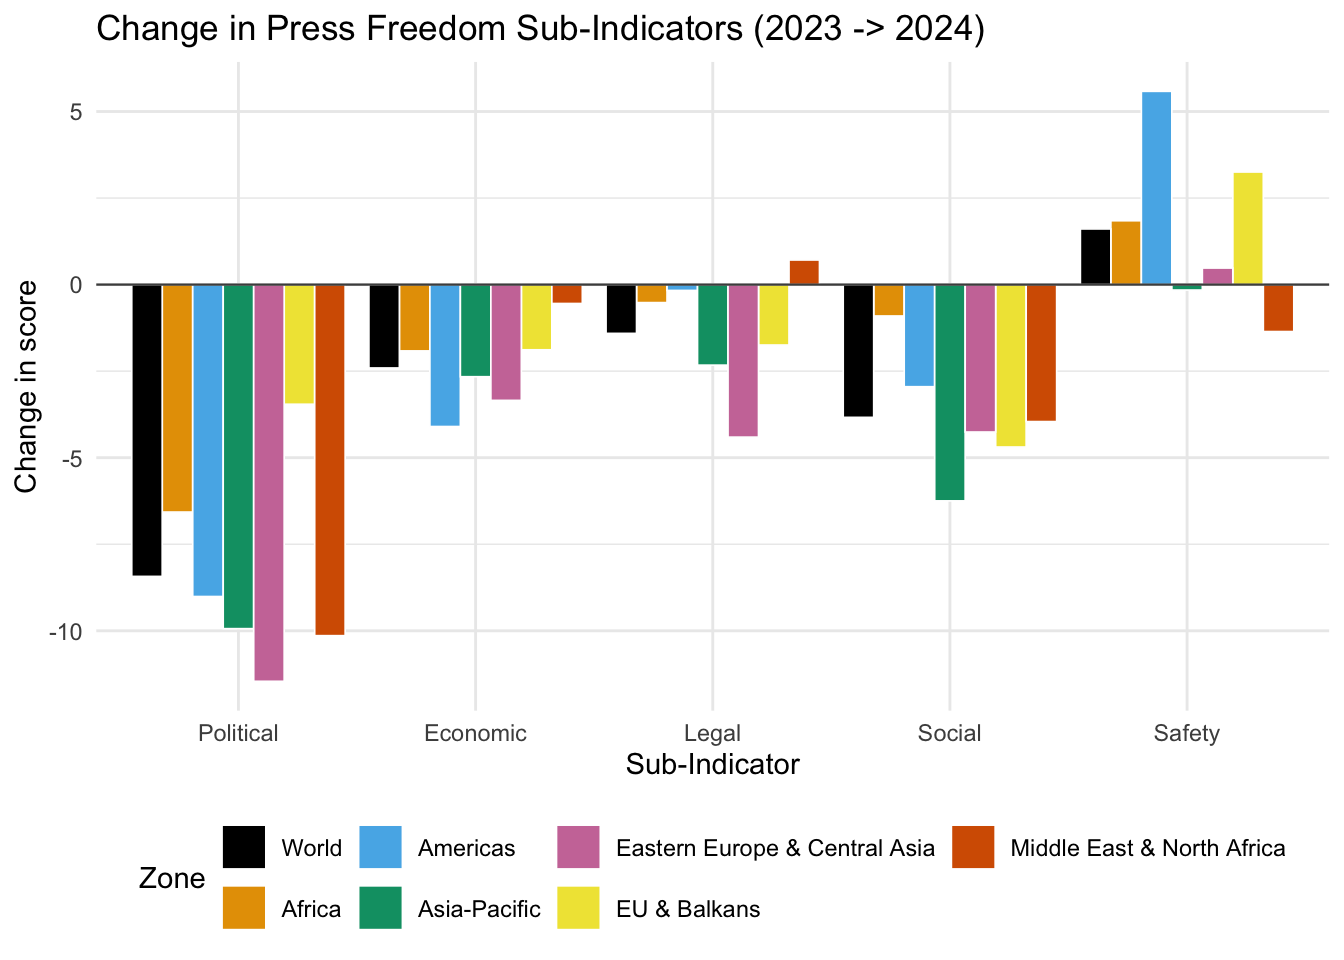
Figure 3: Change in press freedom sub-indicators, 2023→2024, by zone. Political context shows the steepest and most consistent decline; safety is the only dimension with net improvements in most zones.
The grouped bar chart above compares changes in five sub-indicators – Political, Economic, Legal, Social, and Security – across six global zones and worldwide. Most sub-indicators show a negative change in most regions, except “Security,” which shows a positive trend in most zones. The political dimension clearly contributed most to the overall decline.
Political: All zones show a strong decline in score. The most significant declines are seen in Eastern Europe & Central Asia, Asia-Pacific, and the Americas. Overall, the decline in the political dimension of press freedom contributes most to the overall decline in press freedom.
Economic: All zones show a decline in score.
Legal: Most zones show a slight decline in score. The Middle East & North Africa is the only zone that shows a slight increase.
Social: All zones show a fairly strong decline in score. The Asia-Pacific region shows the strongest decline in this category.
Security: This is the only category in which most zones show a positive change. The Americas and the EU & Balkans show the largest gains. The Middle East & North Africa is the only zone that declines in this category.
The pattern is unambiguous in a way the 2021–2022 map never quite was: political context fell furthest, in nearly every zone. The world average political score dropped 8.4 points — more than double the drop in any other dimension. Eastern Europe & Central Asia (−11.5) and the Middle East & North Africa (−10.1) show the steepest political declines; even the EU & Balkans, the most stable zone throughout this series, lost 3.5 points.
Safety moves in the opposite direction. The world average actually rose slightly (+1.6), driven by improvements in the Americas (+5.6) and EU & Balkans (+3.3). Africa and Eastern Europe & Central Asia also improved modestly. Only the Middle East & North Africa (−1.4) and Asia-Pacific (−0.2) saw safety decline, and only slightly. Economic, legal, and social context showed smaller, more mixed changes across zones—none approaching the size of the political decline.
Regional patterns worth noting
EU & Balkans stayed the most stable zone across both political context and safety — consistent with its position throughout this whole series.
Americas had a real political decline but partially offsetting safety gains, which is visible directly in the decomposition chart above.
Asia-Pacific and Eastern Europe & Central Asia show the least favorable combination: political decline and safety decline in the same direction, rather than one offsetting the other.
Middle East & North Africa declined across nearly every dimension, extending an already low baseline rather than showing a distinct new pattern.
RSF’s Qualitative Reporting
Three named developments in RSF’s reporting for this period line up with the political-context finding:
a wave of government hostility toward the press in countries not usually flagged as authoritarian,
2024’s status as the largest global election year on record (elections tend to sharpen pressure on journalists before and after the vote), and
continued spread of “foreign agent” style legislation from Russia into neighboring states. None of that substitutes for the decomposition above, but it’s consistent with it.
A few individual countries illustrate the pattern concretely. Argentina’s rank fell from 40th to 66th (score down 10.3 points) following its change in government; the United States fell from 45th to 55th (score down 4.6); Italy fell from 41st to 46th (score down 2.2). None of these are conflict zones or authoritarian states — they’re established democracies where RSF’s political-context indicator specifically registered deterioration.
Summary
The data indicates a general decline in press freedom across almost all measured sub-indicators (political, economic, legal, and social) for most global regions. The only area showing improvement is the “Security” sub-indicator, particularly in the Americas and the EU & Balkans.
While political factors primarily drove the 2023/2024 crisis, the 2026 situation has deteriorated mainly because of the criminalization of critical reporting. Additionally, “persistent factors” such as economic pressure from large (non-edited) internet platforms, as well as the rise of right-wing governments that make no secret of their hostility toward independent journalism and constantly restrict press freedom through legislation, have worsened the situation.
Two crises, two different shapes
Summarizing these two crisis described in this post, the contrast is fairly stark. 2021–2022 was, by RSF’s own account, about information chaos and geopolitical conflict, spread across several distinct mechanisms that a single aggregate score obscured — and I could only reconstruct it qualitatively, because the sub-indicators weren’t published that year. 2023–2024 is more directly measurable: political context moved further and more consistently than anything else, in a year when RSF itself pointed to direct government hostility toward the press, an unusually large global election cycle, and continued economic strain on independent media.
If you’d like to check any of these numbers yourself, the Shiny app has the full country-level data and lets you rerun this kind of comparison for any pair of years.